

Every material behaves differently under load. Some stretch easily. Some break without warning. Engineers need a way to predict this behavior before a part fails in real use. This is where the stress-strain curve comes in. It is one of the most useful tools in material science. It shows exactly how a material responds as force is applied to it, step by step, until it finally breaks.
This guide explains what the curve means, how it is created and why it matters so much in engineering and manufacturing.
What Is a Stress-Strain Curve
A stress-strain curve is a graph. It plots stress on one axis and strain on the other. Stress is the force applied to a material, divided by its cross sectional area.
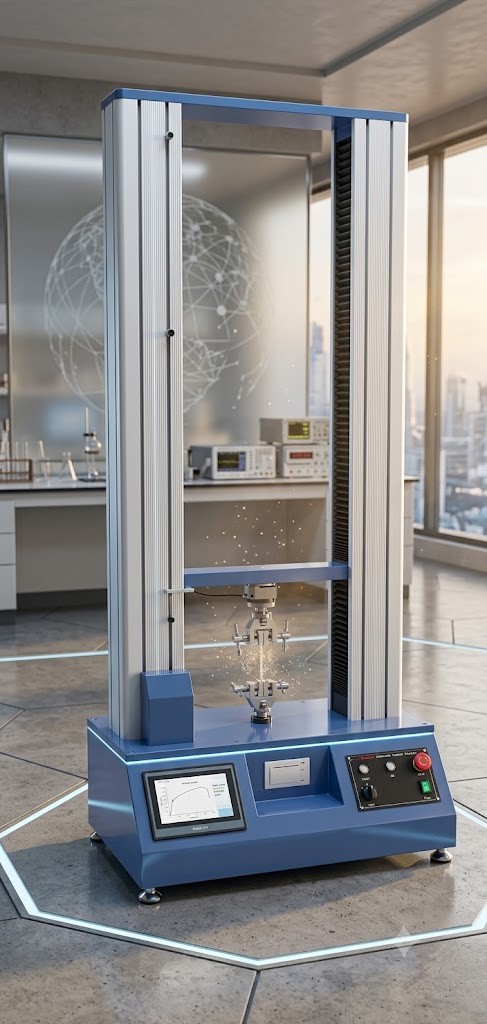
Strain is the amount the material stretches, compared to its original length. To create this graph accurately, a sample is pulled apart using a tensile test machine, OTS Technik, until it deforms and eventually breaks.
The machine records the force and the elongation at every moment. These readings are then converted into stress and strain values. The result is a line that tells a clear story about the material’s strength, flexibility and breaking point.
The Elastic Region
At the very start of the curve, the line is straight. This part is called the elastic region. In this stage, the material stretches under load, but it returns to its original shape once the load is removed.
Think of a rubber band. Pull it gently and let go. It snaps back. Metals behave the same way, but only up to a certain point. The slope of this straight line is called the modulus of elasticity. A steeper slope means a stiffer material.
A flatter slope means a more flexible one. Engineers rely on this part of the curve to design parts that must not permanently deform during normal use.
The Yield Point
As more force is applied, the material reaches a point where it stops behaving elastically. This is called the yield point. Beyond this point, the material will not return to its original shape, even if the load is removed. It has been permanently changed. This point is critical for engineers.
It marks the boundary between safe, reversible deformation and permanent damage. Products like car frames, bridges and machine parts are designed to stay well within this yield region, so they never bend or warp during regular use.
The Plastic Region
After the yield point, the curve enters what is called the plastic region. Here, the material keeps stretching, but with less resistance than before. It absorbs more energy and becomes thinner in some areas.
This is often visible as necking, where the material narrows right before it snaps. This stage tells engineers how much a material can bend or deform before it truly fails.
Some materials, like certain plastics, have a long plastic region. This makes them useful in situations where flexibility matters more than rigidity.
The Fracture Point
Eventually, the material reaches its limit. It can no longer hold together and it breaks. This is called the fracture point, and it marks the very end of the curve.
The stress value at this point shows the maximum load the material can handle before complete failure. Engineers study this point closely, especially when designing safety critical components.
A part that fails suddenly, without warning, is far more dangerous than one that bends and shows visible signs of stress first.
Why the Curve Matters in Real Life
The stress-strain curve is not just a scientific chart. It has real, practical value. Manufacturers use it to choose the right materials for the right jobs.
A bridge needs steel that resists bending under heavy loads. A phone case needs plastic that can flex without cracking. Without this curve, choosing materials would rely on guesswork.
With it, decisions become based on data, tested and proven under real conditions. This reduces the risk of failure, saves money on wasted materials and keeps people safe in the products they use every day.
How the Curve Is Measured in Practice
Creating an accurate stress-strain curve requires precision. A sample must be shaped and sized correctly. It is then clamped into place and stretched at a steady, controlled speed.
Sensors record the force and displacement continuously, often many times per second. This data is processed into a clean, readable graph. Small errors in setup can lead to misleading results, so calibration and proper technique matter a great deal.
This is why testing is usually done in controlled lab environments, following strict standards, so that results can be trusted and compared across different materials and industries.
Conclusion
The stress-strain curve remains one of the simplest, yet most powerful tools in engineering. It reveals how a material behaves under stress, from its first gentle stretch to its final break. Understanding each stage, the elastic region, the yield point, the plastic region and the fracture point, helps engineers make smarter, safer choices.
Whether designing a small household item or a massive steel structure, this curve provides the evidence needed to build with confidence. For anyone serious about accurate results, using a reliable tensile test machine, OTS Technik, ensures that the data behind every curve is precise, consistent and ready to guide real world decisions.