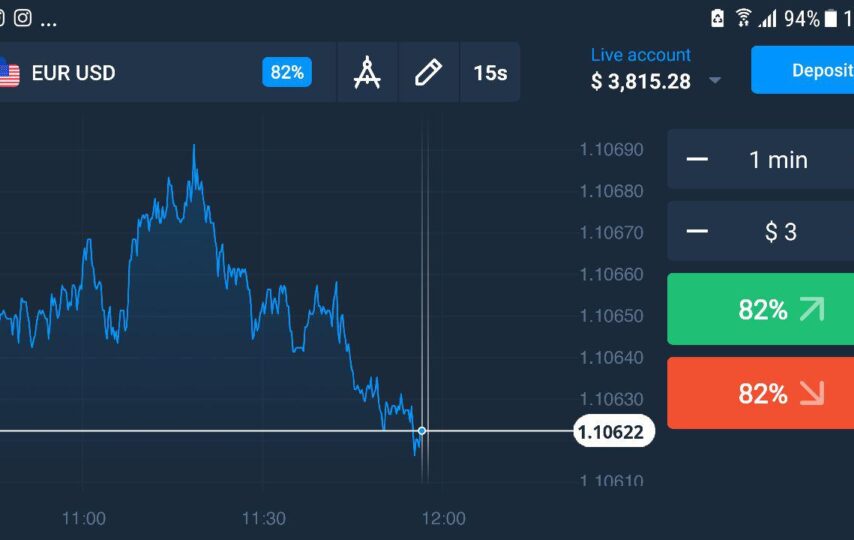
Technical analysis has been gaining popularity as an effective way to approach trading. Some of the credits may be inflicted on different trading platforms and charting packages. For the way of their nature and learning process, novice traders can find technical analyses hard to conceptualize. This post will go somewhat deep into these analyses to let readers have an effortless grip over the topic.
What is Technical Analysis?
They refer to the study and research about the price movements in the market. It features different chart patterns and other indicators to detect and predict future trends.
It is a way of visually representing the historical and concurrent performance of the market. It allows traders to utilize this information which are delivered in the form of price action patterns, and indicators to guide and inform future potential movements before engaging in a trade. Let’s know about some core trading approaches and ways to implement them into your trading strategy.
Understanding Different Technical Analyses
Technical analysis is most of its part, is the general interpretation of charts and patterns. Traders get all the historical information, which is mostly based on price and volume. They use that information to recognize trading opportunities depending on common patterns.
While fundamental analyses patrons love to believe that financial factors are the prime contributors to all types of momentum in the market, the backers of technical ones maintain that the previous trends can predict future price shifts.
As a trader, you should remember the fact, ETF trading is all about finding the perfect trades based on technical and fundamental analysis. Unless you become good at analyzing the price action signals, you will never find the perfect place to execute the trades.
Perks of Using Technical Analyses
Most of the traders have found these instruments much handy in managing risks and dealing with all the other obstacles to the ultimate Forex market. After capturing a solid understanding of the concepts and rules of these instruments, traders can apply the knowledge to any market. This feature makes them a really flexible tool. Where other inspection instruments look to recognize intrinsic value in the market, technical ones look to recognize trends. These trends can be caused most of the time by the underlying fundamentals.
Perks of Using Technical Analyses include the below points
- They can be utilized to any type of market deploying any timeframe
- They happen to have all the features to be a standalone method
- They allow traders to recognize potential trends in the market
Using Charts
Charts are the main types of technical instruments. Because the most important measure of Forex industry is its previous and present performance is the prices of different currencies. This is the initiation point when digging deeper into inspecting a trade’s potential. Price action can be depicted clearly and most understandably on various charts.
Charts help in realizing the nature of the overall trend, no matter it’s an upward or downward movement, either long-termed or short-term, to recognize range-bound phases. The most general types of charts are bar, line, and candlestick charts.
Indicators
Indicators are deployed by traders to identify a possible opportunity. Though many indicators are in use nowadays, traders often use price-based and volume base indicators. These assist them in determining where the market has set the resistance and support levels.
Traders can view the price or any other indicators using various time frame analyses. They range from a single second to an entire month to give market participants a unique perspective of the price action.
The most popular indicators are:
- Moving Average
- Moving Average Convergence Divergence (MACD)
- Relative Strength Index (RSI)
Every one of these is highly reliable and can change the game for a trader. If anyone is considering reading and inspect the market, there is no better way to do it than by using these tools.


