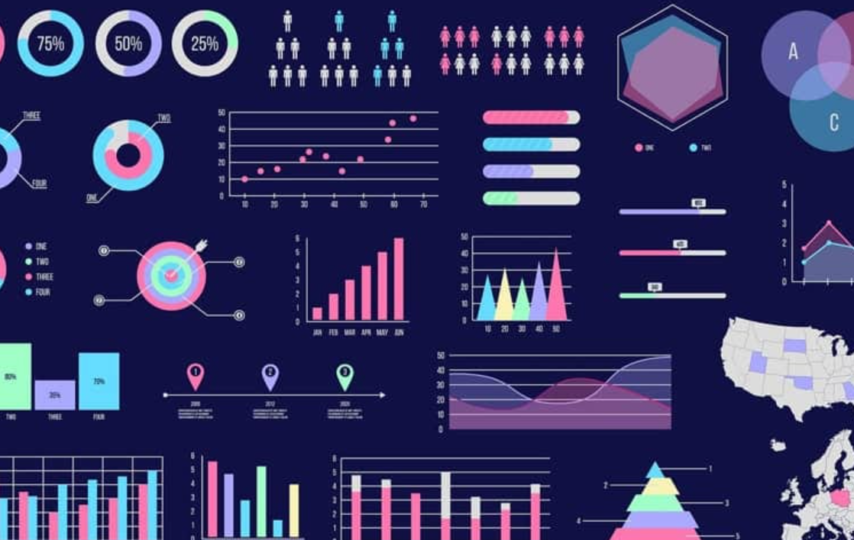
As businesses use more data in their operation, making sense of everything becomes more complicated. So, data visualization is expected to become popular. It is the true art of transforming numbers into illuminating images that unlock insights and drive informed decisions.
However, innovative and modern technologies flood the market and in this article, S-Pro will talk about new tools and techniques for data visualization. Buckle up and prepare to dive into the trends that will dominate the future of data visualization!
The Evolution of Data Visualization
We have used charts and graphs for so long that it seems like forever. But, unfortunately, the statistical way of showing information is slowly dwindling away. Now, you need more than just one look at diagrams when we have more innovative ways of showing data.
New technologies, such as artificial intelligence (AI) and augmented reality (AR) allow businesses to create more interactive, engaging, and informative ways to uncover insights. For example, with AR a business can create a 3D map for their needs, or with AI monitor data in real-time.
Dominating Trends for the Next Decade
The future of data visualization has huge potential, and several trends are poised to dominate the next decade. Let’s have a closer look at them.
AI-Powered Insights and Automation
AI tools can help in automating monotonous tasks like data cleaning. Moreover, the tools can analyze vast datasets and recommend the most suitable visualization type (charts, heatmaps, etc.).
For example, a marketing team can leverage AI to analyze customer purchase data. This means that the tool will have access to the buyer’s data, and analyze the popularity of certain items among certain groups. Later, this data can be used for demand forecasting. And it can be visualized in the form of a real-time updating chart or dashboard.
AR and VR
The next big deal in big data is AR and VR technologies. They are transforming data visualization into an immersive experience. In short, these technologies enable users to interact with the data, drill down into specific details, and gain a more intuitive understanding of complex relationships.
These technologies can have many uses, for example, architects can utilize VR to create interactive 3D models with embedded data visualizations. Your business clients, in turn, can walk through virtual spaces or try samples of your goods in their homes. A good example is a furniture store that might allow a virtual display of certain furniture in full size just within the store’s app.
Real-Time Data Visualization
Real-time data visualization can become a true need for businesses that have quickly updated data. This is especially true for retail, e-commerce, and fintech businesses.
Real-time data visualization focuses on creating dynamic dashboards that can be updated in real-time, continuously. This idea allows business owners to track trends, identify bottlenecks and problems in business processes, and make data-driven decisions. Overall, it can offer a crucial advantage in many scenarios. For example, when a retail business sees that there is a surge in demand for a certain item, it could restock quickly. It would also enable businesses to make the problem-solving process faster.
One more example can be a financial institution in need of monitoring stock market fluctuations. The data is updated quickly in the field, so real-time visualization would be the best option. Interactive dashboards would display the price movements, trends, and threshold breaches live. And this, in turn, would empower traders to make quick decisions.
Data visualization is one of the best solutions for data-driven decision-making. So, if you are interested in it – don’t wait, contact a development company like S-Pro today!