In the modern business landscape, data reigns supreme. Organizations generate vast amounts of data daily, encompassing everything from sales figures and customer interactions to website traffic and financial performance. Amid this data deluge, the challenge lies not in collecting information but in effectively translating it into actionable insights. This is where dashboard reporting software comes into play, revolutionizing the way businesses visualize and make sense of their data. This article will explore how this software enhances data visualization, empowering organizations to extract valuable insights and make informed decisions.
1. Centralized Data Integration
One of the key ways this software improves data visualization is by centralizing data integration. In many organizations, data resides in various systems and formats, making it challenging to create a comprehensive view. Dashboard reporting tools pull data from multiple sources and consolidate it into a unified dashboard. This centralized approach streamlines data access and provides a single source of truth, facilitating more accurate and meaningful visualizations.
2. Real-time Data Updates
Effective data visualization relies on the timeliness of information. Traditional reporting methods often involve manual data entry and updates, leading to delays and potential inaccuracies. Dashboard reporting software, on the other hand, offers real-time data updates. Users can access the most current data, ensuring their visualizations are always up-to-date. This real-time feature is invaluable for decision-makers who need to react swiftly to changing circumstances.
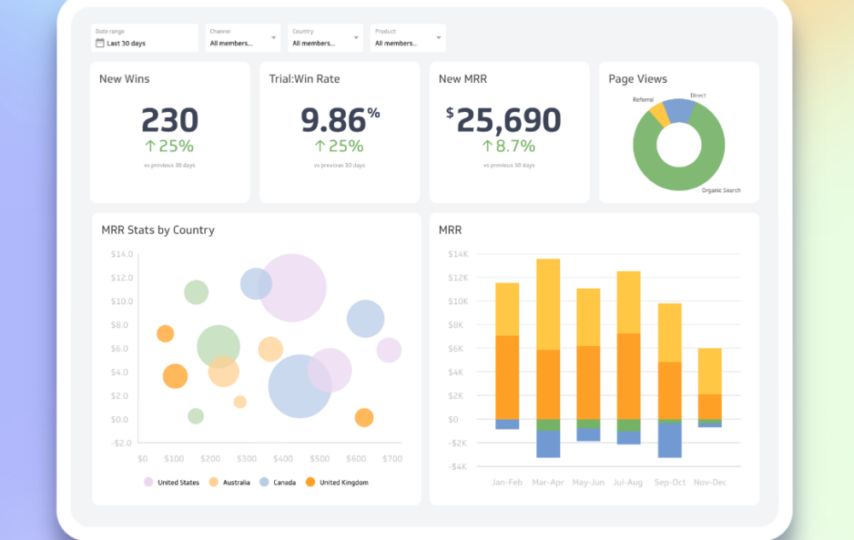
3. Interactive Visualizations
Static charts and graphs can only convey so much information. This software goes beyond static visuals by offering interactive capabilities. Users can drill down into data, filter information, and explore trends. Interactive visualizations allow for a deeper understanding of data, enabling users to uncover insights that may have remained hidden in traditional static reports.
4. Customization and Personalization
Every organization has unique data needs and objectives. The software recognizes this diversity by offering customization and personalization options. Users can tailor their dashboards to display the specific metrics and KPIs relevant to their roles and goals. This customization ensures that data visualization serves the exact needs of individual users, enhancing its relevance and usability.
5. Diverse Visualization Options
Effective data visualization is not one-size-fits-all. Different data types and scenarios require diverse visualization methods. Dashboard reporting software provides various visualization options, from bar charts and pie graphs to heat maps and scatter plots. Users can choose the most appropriate visualization technique for their data, ensuring it is presented most understandably and compellingly.
6. Mobile Accessibility
In today’s mobile-driven world, access to data on the go is crucial. Many software solutions offer mobile accessibility, allowing users to view and interact with their data visualizations on smartphones and tablets. This flexibility ensures that decision-makers are not tethered to their desks and can access vital information wherever they are.
Conclusion
In an era where data is abundant but insights are invaluable, dashboard reporting software emerges as a vital tool for organizations seeking to harness the power of their data. By centralizing data integration, providing real-time updates, offering interactive and customizable visualizations, and accommodating mobile access and collaboration, these tools enhance data visualization in ways that empower users to make informed decisions. The impact of dashboard reporting software extends beyond data representation; it transforms data into a dynamic asset, driving a deeper understanding of business performance and facilitating strategic actions.