Kubernetes is an open-source platform for managing and deploying containers, which are units of software that include all the necessary components for running an application. It helps you automate the process of scaling, deploying, and operating your applications, making it easier to manage large, complex applications.
In simpler terms, Kubernetes provides a way to simplify the deployment and management of containerized applications by providing a set of tools and abstractions for running and coordinating containers across multiple machines.
To read more about Kubernetes click here.
What Are Microservices
Microservices are a way of building and organizing software applications. Instead of building an extensive, complex application all at once, you build smaller, simpler parts with microservices. Each piece is its microservice and handles a specific task or function. These microservices work together to build a complete application.
The benefit of this is that it makes it easier to develop, test, and deploy your applications. Each microservice can be developed and tested independently, which makes it easier to catch and fix any problems. And because each microservice is smaller and more straightforward, it’s also easier to update or change just one part of your application without affecting the rest.
Another advantage of microservices is that they’re more flexible and scalable. Suppose one part of your application becomes more popular or needs more resources. In that case, you can quickly scale just that one microservice without climbing the entire application. And because each microservice is independent, you can use different technologies or programming languages for other microservices if needed.
Microservices build applications that are easier to develop, test, deploy, and manage. By breaking down an extensive, complex application into smaller, simpler parts, you can make your life as a developer or DevOps engineer much more accessible.
Why Monitoring Is Essential In Kubernetes
Monitoring is like keeping an eye on things. It’s about ensuring everything runs smoothly and catching any problems before they become big headaches. Monitoring is essential for a few reasons regarding Kubernetes and the applications you’re running with it.
First, monitoring helps you track what’s going on with your applications. You can see how many resources they’re using, how many requests they’re getting, and all sorts of other helpful information. This helps you make sure your applications are running efficiently and effectively.
Second, monitoring helps you catch problems early. Let’s say one of your applications suddenly starts using many more resources than usual. With monitoring, you’ll know right away and can take action to fix the problem before it becomes a big issue.
Third, monitoring helps you keep your applications up and running. If one of your applications crashes or goes down for some reason, monitoring will help you know about it and take action to bring it back up. This is especially important when you’re running many applications simultaneously and need help keeping an eye on everything all the time.
All in all, monitoring is essential to keep your applications running smoothly and catch any problems before they become big headaches. With monitoring, you can know that your applications are always running the way they should be.
How ELK Helps To Monitor The Kubernetes Cluster
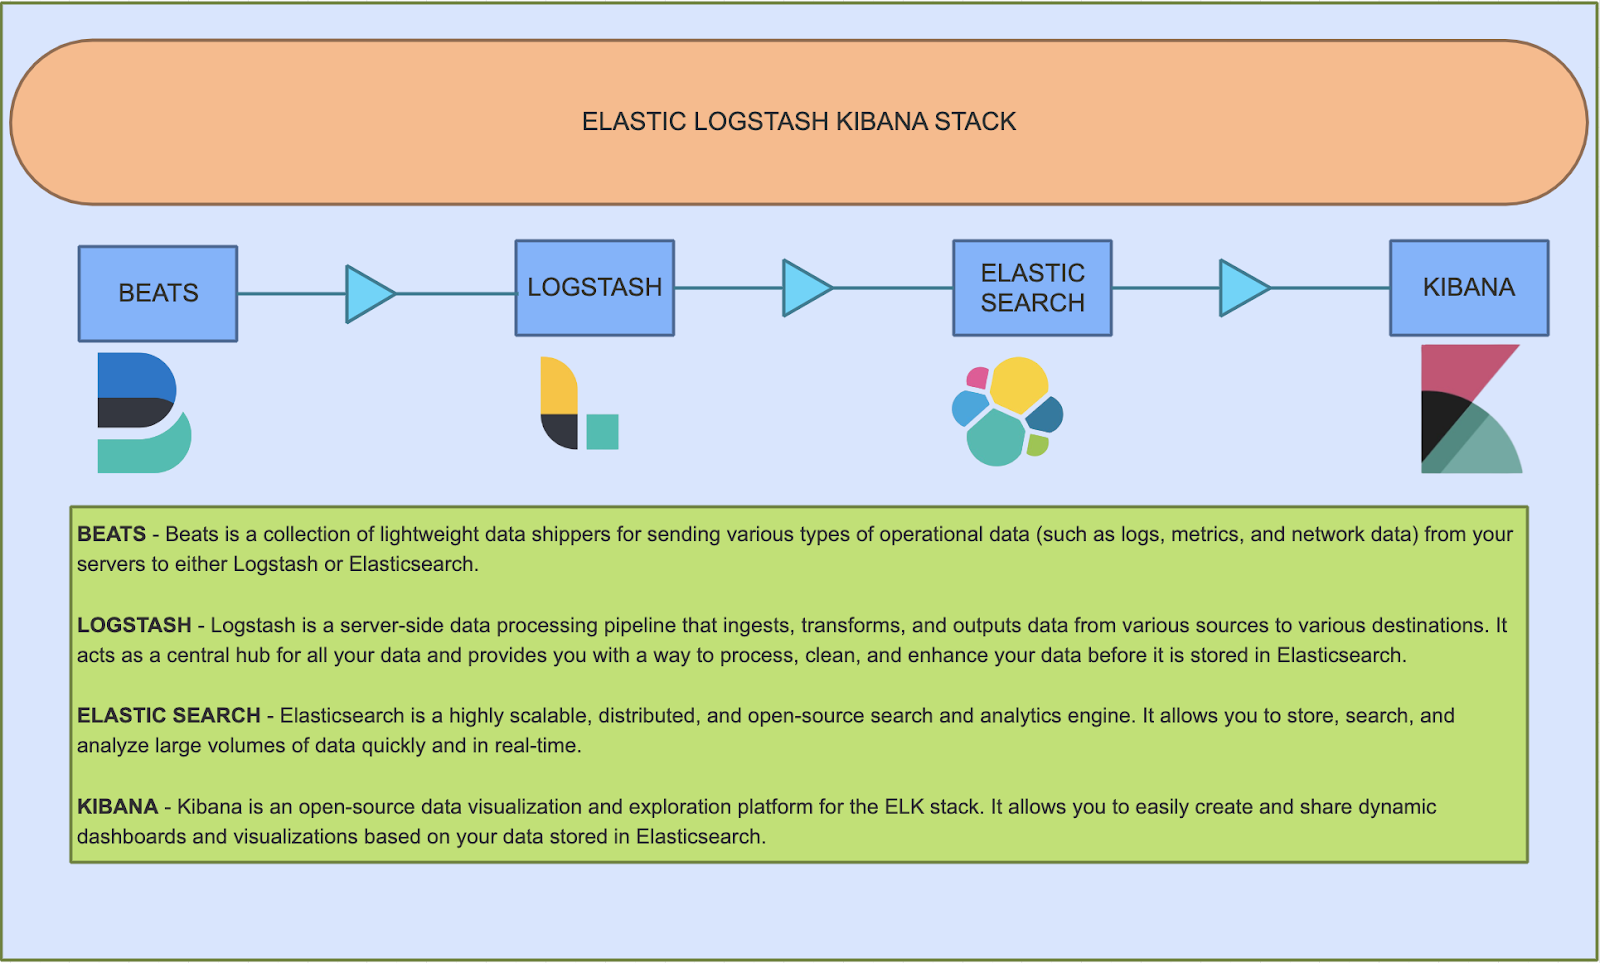
ELK stands for Elasticsearch, Logstash, and Kibana. It’s a stack of open-source tools that help you store, search, and visualize your logs and other data.
Think about all the data that’s generated by your applications and infrastructure. All those logs and metrics can be handy for understanding what’s happening. Still, making sense of all that information can also be challenging. That’s where the ELK stack comes in.
Elasticsearch is a search and analytics engine. It’s the place where you store all your data so you can search and analyze it. Logstash is a data processing pipeline. It takes all your logs and data and processes it so it can be stored in Elasticsearch. And Kibana is a visualization tool. It helps you make sense of all that data by creating charts, graphs, and other visualizations.

Using the ELK stack, you can collect and store all your data in one place, search and analyze it quickly and easily, and create valuable visualizations that help you understand what’s happening. This can be helpful for troubleshooting problems, monitoring your applications and infrastructure, and making data-driven decisions.
So if you’re looking for a way to make sense of all the data your applications and infrastructure are generating, the ELK stack might be just what you need!
What Are Beats In the ELK Stack?
Beats are like little helpers that work with the ELK stack. They’re lightweight data shippers that collect data from your servers and applications and send it to the ELK stack for processing and storage.
When you’re working with the ELK stack, you need to get all your data into Elasticsearch so you can search and analyze it. That’s where Beats come in. Beats are specifically designed to collect data from various sources and send it to the ELK stack.
There are different types of Beats for different types of data. For example, there’s Filebeat for collecting logs, Metricbeat for collecting metrics, and Packetbeat for collecting network data. Each Beat is optimized for a specific data type and can be easily configured to collect the data you need.
So instead of manually collecting and sending all your data to the ELK stack, you can use Beats to do it for you. Beats are fast, lightweight, and easy to set up, so you can get your data into the ELK stack quickly and easily.
In short, Beats are like little helpers that make it easier to collect and send data to the ELK stack. Using Beats, you can save time and effort and get all your data into the ELK stack to search, analyze, and visualize it.
What Is Logstash In ELK?
Logstash is one of the components in the ELK stack (which stands for Elasticsearch, Logstash, and Kibana). Logstash is a data processing pipeline that helps you get your data into Elasticsearch so you can search, analyze, and visualize it.
Consider all the data your servers and applications generate – logs, metrics, and other data. You might have data from different sources, and it might be in various formats. Logstash helps you normalize this data so it can be stored in Elasticsearch.
Logstash has a simple plugin-based architecture that makes it easy to collect, process, and send data to Elasticsearch. You can use Logstash to collect data from different sources, process it, and send it to Elasticsearch for storage. You can also use Logstash to perform various transformations on your data, such as filtering, enriching, and aggregating it.
Logstash is like the workhorse of the ELK stack. It helps you collect your data from various sources, process it, so it’s ready to be stored in Elasticsearch, and send it there. Using Logstash, you can ensure your data is in the correct format and prepared to be analyzed and visualized.
What Is ElasticSearch In The ELK Stack?
Elasticsearch is the heart of the ELK stack. It is a powerful, open-source search and analytics engine that you can use to search, analyze, and visualize your data. If you want to be able to search and analyze this data quickly. That’s where Elasticsearch comes in. It provides fast and flexible search capabilities that you can use to search through your data and find what you’re looking for.
Elasticsearch is designed to scale horizontally, so you can add more nodes to your cluster to handle more data and more search requests. It also has a rich set of APIs that you can use to interact with your data, so you can write your custom applications that work with your data stored in Elasticsearch.
Elasticsearch is a search and analytics engine that you can use to store, search, and analyze your data. It’s fast, flexible, and scalable, providing a rich set of APIs you can use to interact with your data. With Elasticsearch, you can turn your data into actionable insights and make better, data-driven decisions.
What Is Kibana In ELK
Kibana is the third and final component in the ELK stack. Kibana is a robust visual analysis and exploration tool that you can use to make sense of your data stored in Elasticsearch.
Think about all your data in Elasticsearch – logs, metrics, and other information generated by your servers and applications. This data can be hard to understand by looking at the raw text. Kibana provides a way to visualize your data, so you can see patterns, trends, and relationships that might not be immediately obvious.
With Kibana, you can create custom dashboards, graphs, and charts that help you understand your data better. You can use Kibana to search and filter your data, and you can also use it to create alerts that notify you when certain conditions are met. Kibana also provides a way to share your dashboards and visualizations with others so you can collaborate on your data analysis.
Kibana is like the icing on the cake for the ELK stack. It provides a way to visualize your data stored in Elasticsearch, so you can make sense of it and uncover insights that might take time to be noticeable. With Kibana, you can turn your data into actionable insights and make better, data-driven decisions.