Picture this: It’s the digital age, and the world of trading is buzzing with the word ‘NFTs.’ These digital assets are more than just virtual collectibles; they’re a rapidly evolving market teeming with data. Navigating this data-laden universe without the right tools is like trying to spot a shooting star in broad daylight. Enter the scene, interactive dashboards that are illuminated with the brilliance of blockchain activities, powered by indexer data, ready to guide traders through the night sky of the NFT marketplace.
The rise of interactive dashboards
Indexers are the unsung heroes of the blockchain world, diligently sorting through heaps of data to bring order and clarity. It’s the transformation of this data into interactive dashboards that has the trading community talking. Imagine a seamless flow of information rendered into user-friendly visuals, offering traders not just numbers but a narrative of what’s hot, what’s not, and where the tide is turning in the ocean of NFTs. It’s not just about data; it’s about crafting a story that resonates at first glance.
Nailing the essentials of a trader-friendly NFT dashboard
Traders are a picky bunch, and they demand the very best from their tools. A top-notch NFT dashboard isn’t just a static page; it’s a dynamic cockpit that needs to deliver real-time data faster than a falcon in flight. But speed is only part of the equation; it must also transform the complex labyrinth of blockchain analytics into digestible bits of wisdom. Let’s not forget about customizability – traders love to tweak their tools like a skateboarder adjusting their trucks – it’s all about making it feel just right.
Integrating advanced analytics for deeper insights
There’s a lot more to the NFT market than meets the eye, and a sophisticated dashboard ought to be the looking glass that traders need. Incorporating advanced analytics can give traders a glimpse into the future, predicting trends and market moods like a mystic reading tea leaves. With a dive into network activities and an analysis of how trends wax and wane, these dashboards can reveal the tapestry of past and present, essential for spotting the next big wave.
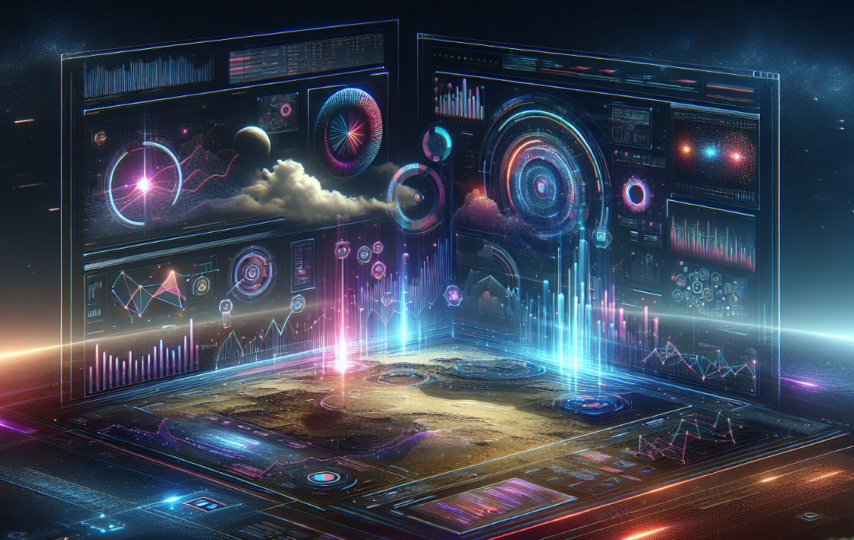
Visual storytelling with data: making every pixel count
Who said data can’t be dazzling? Modern dashboards do more than just show information; they use the art of visual storytelling to turn every byte of data into a visual feast. Infographics and heatmaps can turn the complex dance of market data into an image as telling as a Renaissance painting. Savvy color schemes highlight the ebb and flow of market dynamics, drawing the eye to profitable patterns, while animations add that spoonful of sugar to make the infographic look interesting and informative.
Design principles to enhance navigation and use
A well-designed dashboard should be a minimalist masterpiece. With a less-is-more approach, it eschews the clutter for a clean look that cuts through the chaos, maintaining the focus on what truly matters. It paves the way for a seamless experience where accessibility is not an afterthought, ensuring that every trader, regardless of their physical abilities, is welcome to the party. And let’s not forget the traders on the go – a mobile-optimized dashboard ensures that even when they’re hopping from café to café, their data dashboard is comfortably sitting in their pocket.
The security aspect: protecting data integrity and user privacy
In a world where data breaches are more common than rain in London, the security of a dashboard is non-negotiable. It’s about striking the perfect harmony between being transparent with data and fortifying it against digital threats. Data integrity and user privacy are the cornerstones of trust in any platform, after all. Ensuring that a trader’s dashboard is as secure as the Queen’s jewels is not just an option; it’s imperative.
Traders of today are not just making transactions; they’re interpreting a symphony of data to orchestrate their success. With NFT data visualization, these maestros can transform the cacophony of information into harmonious insights. Dashboards provide the baton they need to lead their orchestra in the grand concert hall of the digital marketplace.