In today’s digital environment, graph analytics revolutionizes investigating complex relationship dynamics in enormous information. Businesses must understand complex networks including social interactions, supply chains, and IoT devices to make data-driven decisions and stay ahead of the competition. The development in data reliance highlights the relevance of graph analytics, which brings new insights into relational data and enables us to examine trends, patterns, and outliers—advanced data integration engineering powers graph analytics. Graph analytics has the potential to transform how firms use data for strategic decision-making.
Improving Your Graph Analytics Skills
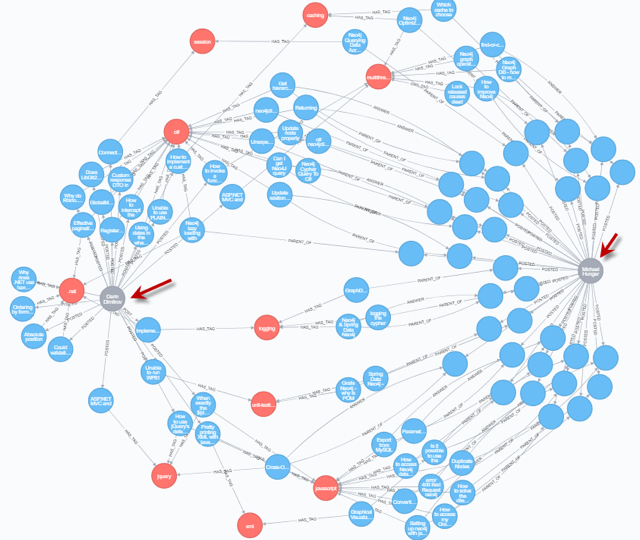
Graph analytics is essentially concerned with analyzing graph structures, consisting of nodes (or vertices) that stand in for entities and edges (or links) that show the connections between them. The conventional wisdom in data analytics has long centered on numerical and categorical data analysis, but this new methodological approach is very different. On the other hand, graph analytics delves into the relational side of data, allowing for a detailed investigation of entities’ interactions within a network. This analytical method provides a multidimensional view of data that is not possible with more conventional approaches, and it really comes into its own when the importance of relationships is higher than that of the individual data points’ properties.
Graph analytics finds network communities, centers, and linkages using complicated algorithms. Connectivity research shows entity interconnectedness by studying node pathways and relationships. Critical nodes, actors, and locations can be identified using degree, proximity, and betweenness centrality. Community discovery algorithms uncover hidden data by grouping nodes by patterns or relationships. Graph analytics’ analytical power makes it invaluable for uncovering new information, detecting abnormalities, enhancing network efficiency, and predicting trends.
The Function of Engineering Services for Data Integration
To maximize graph analytics, data from multiple sources must be smoothly integrated. Data integration engineering services combine data sets in a meaningful way to provide a comprehensive, consistent dataset that can be evaluated. Comprehensive and accurate graphics are needed to illustrate organizational ecosystems and market dynamics in real life.
Brickclay leads enterprises in graph analytics adoption with its cutting-edge data integration engineering services. Brickclay helps businesses integrate data by bringing together siloed sources of information and making it consistent and trustworthy. Businesses must emphasize this basic endeavor to employ graph analytics for complex relationship analysis, better decision-making, and strategic initiative advancement. Brickclay’s data integration and analytics solutions may boost operational efficiency, actionable insights, and industry innovation. This prepares for a data-driven future.
Use in Complex Relationship Analysis
From banking and medical to telecoms and social media, graph analytics has many applications. In order to better comprehend client interactions, identify trends in fraud, and evaluate risk, financial institutions including banks and insurance firms use graph analytics. The best way for financial institutions to safeguard their customers’ funds is to monitor their transactions, accounts, and users for any unusual activity that could be a sign of fraud.
Graph analytics helps doctors track patients, understand illness development, and find new treatments. Clinical outcomes, treatment histories, and patient data help doctors improve patient care, uncover illness linkages, and evaluate therapy efficacy. Relational analysis, part of customized medicine, improves patient outcomes and healthcare efficiency.
Telecommunications companies employ graph analytics to improve resource management, customer service, and network architecture. Some companies can predict traffic congestion, uncover network security flaws, and develop unique customer experiences by researching customer interactions, network traffic, and phone data. The upshot is happier consumers, better service, and more reliable networks.
In order to better understand user behavior, make content recommendations, and encourage community formation, social media networks utilize graph analytics. These platforms may personalize user experiences, encouraging engagement and growth, by looking at user relationships, interactions, and shared material. In addition to making the internet a safer place for everyone, this relational analysis can help find and stop the spread of false information.
Elevating HVAC KPIs
When it comes to building management, graph analytics is key for improving the performance and efficiency of the HVAC key performance indicators system. Energy usage, environmental conditions, and maintenance needs may all be optimized with the help of graph analytics, which building managers can implement by combining data from sensors, controllers, and user inputs. By using this data-driven method, HVAC system inefficiencies like uneven heating or cooling distribution, poor air quality, and worn-out equipment can be identified.
Engineering services for data integration make this optimization possible by guaranteeing the correct merging and processing of data from multiple sources, giving a complete picture of the HVAC system’s efficiency. By examining system component-environmental interactions, management can reduce energy costs, improve occupant comfort, and improve HVAC KPIs. Predictive maintenance, enabled by graph analytics, optimizes key performance parameters, reducing downtime and extending HVAC equipment life.
Strategic Executive and Decision-Maker Benefits
Graph analytics may help CEOs, C-suite executives, Managing Directors, and country managers improve operations and build long-term strategy. Graph analytics illuminate organizational networks, customer interactions, and market dynamics, helping these executives innovate and succeed.
Graph analytics helps managers identify influential people, streamline communication, and improve teamwork. Customer relationship management targeting and customer care increase by segmenting clients by interactions and preferences. Graph analytics in market research helps understand trends, future market movements, and competition.
In Summary
With AI and machine learning, graph analytics will be much more powerful. This will improve understanding and prediction of complex relationships. The expanding number of firms using it shows its adaptability and potential to boost efficiency and creativity.
Graph analytics gives decision-makers an incalculable strategic advantage. It equips leaders with the knowledge necessary to make educated decisions, forecast market trends, and design successful strategies, from increasing predictive analytics to improving customer experiences. Nevertheless, there are obstacles on the road to fully utilizing graph analytics. Concerns about data privacy and security as well as the demand for specialists are challenges that businesses must face and conquer.
For companies that are prepared to take advantage of graph analytics, the future of corporate decision-making looks promising. In the future, we will surely achieve deeper insights, better judgments, and strategic success through the synergy of graph analytics and data integration engineering services.