Candlestick patterns are a type of technical analysis that traders use to identify potential buy and sell opportunities in the financial markets. These patterns are formed by the price action of an asset and can provide valuable information about market sentiment and potential future price movements. In this article, we will take a look at some basic candlestick patterns that every trader should know.
Engulfing Candlestick Pattern
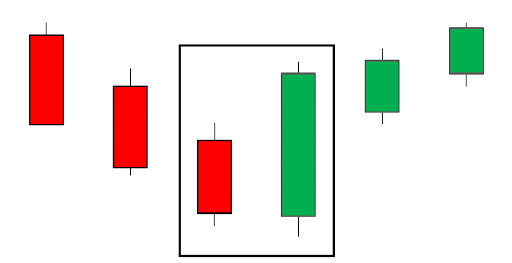
The Engulfing Candlestick pattern is a strong reversal signal that occurs when a small candle is followed by a large candle that completely engulfs the previous candle. The Engulfing candle is considered a bullish signal when it appears at the bottom of a downtrend and a bearish signal when it appears at the top of an uptrend. The key to identifying this pattern is to look for a large candle that completely engulfs the previous candle, with little or no overlap between the two candles.
Hammer and Hanging man

The Hammer and Hanging man patterns are similar in appearance and are considered reversal signals. The Hammer pattern is a bullish signal that occurs when a small candle appears at the bottom of a downtrend, with a long lower shadow and a small real body. This pattern indicates that buyers were able to push the price up, but sellers were able to push the price back down. The Hanging man candlestick pattern is a bearish signal that occurs when a small candle appears at the top of an uptrend, with a long lower shadow and a small real body. This pattern indicates that sellers were able to push the price down, but buyers were able to push the price back up.
Doji

The Doji pattern is a neutral pattern that occurs when the open and close of a candle are at the same or very close to the same price. This pattern indicates indecision in the market, and it can be a sign of a potential reversal. Traders should pay attention to the location of the Doji pattern in relation to the trend, as well as the volume of trading. A Doji pattern that occurs at the top of an uptrend with high volume may indicate a bearish reversal, while a Doji pattern that occurs at the bottom of a downtrend with low volume may indicate a bullish reversal.
Spinning top

The Spinning top pattern is a neutral pattern that occurs when the real body of a candle is small and the upper and lower shadows are long. This pattern indicates indecision in the market, and it can be a sign of a potential reversal. Like the Doji pattern, traders should pay attention to the location of the Spinning top pattern in relation to the trend, as well as the volume of trading. A Spinning top pattern that occurs at the top of an uptrend with high volume may indicate a bearish reversal, while a Spinning top pattern that occurs at the bottom of a downtrend with low volume may indicate a bullish reversal.
Bullish and Bearish Harami

The Bullish and Bearish Harami patterns are similar in appearance and are considered reversal signals. The Bullish Harami pattern is a bullish signal that occurs when a small candle appears within the real body of a larger candle, with the small candle’s color opposite to the larger candle. This pattern indicates that buyers are starting to gain control of the market, and it is a sign of a potential reversal from a downtrend to an uptrend. The Bearish Harami pattern is a bearish signal that occurs when a small candle appears within the real body of a larger candle, with the small candle’s color opposite to the larger candle. This pattern indicates that sellers are starting to gain control of the market, and it is a sign of a potential reversal from an uptrend to a downtrend.
Conclusion
In conclusion, candlestick patterns are a valuable tool for traders to identify potential buy and sell opportunities in the financial markets. The patterns discussed in this article, including the Engulfing pattern, Hammer and Hanging man, Doji, Spinning top, and Bullish and Bearish Harami, are considered some of the most basic and important patterns for traders to know. However, it’s important to keep in mind that these patterns should not be used in isolation, but rather in conjunction with other forms of technical and fundamental analysis to form a comprehensive trading strategy. It also takes practice and experience to become proficient in interpreting these patterns, and traders should always use proper risk management techniques when making trading decisions.