Today, everyone demands answers from their data in a matter of seconds due to the ever-present pressure of time. In this situation, the data is presented visually using data visualization and the accompanying tools. The ability to manage and get insight from massive volumes of data is made possible by these tools. Data visualization simplifies hard-to-grasp connections and ideas. In other cases, however, data visualization may oversimplify, which can seriously affect decision-makers.
What is Tableau?
Tableau, a leading data visualization application used in data analysis and business intelligence, is available. When it comes to analytics and business intelligence, Tableau is at the top of the Gartner Magic Quadrant. Tableau was first created in the United States in 2003, and Salesforce acquired it this past June.
It helps users create charts, maps, dashboards, and stories from their data to understand it better and make better business decisions. With Tableau, it’s encouraged that everyone learns about and be comfortable with their data. If you already have your data in a structured format like Excel or a comma-delimited text file, you may use it instead of connecting to your database.
In Tableau blogs, you can build dashboards that users may interact with.
Features of Tableau
Tableau stands out from the crowd of business intelligence (BI) products on the market thanks to its many innovative features.
These characteristics are as follows.
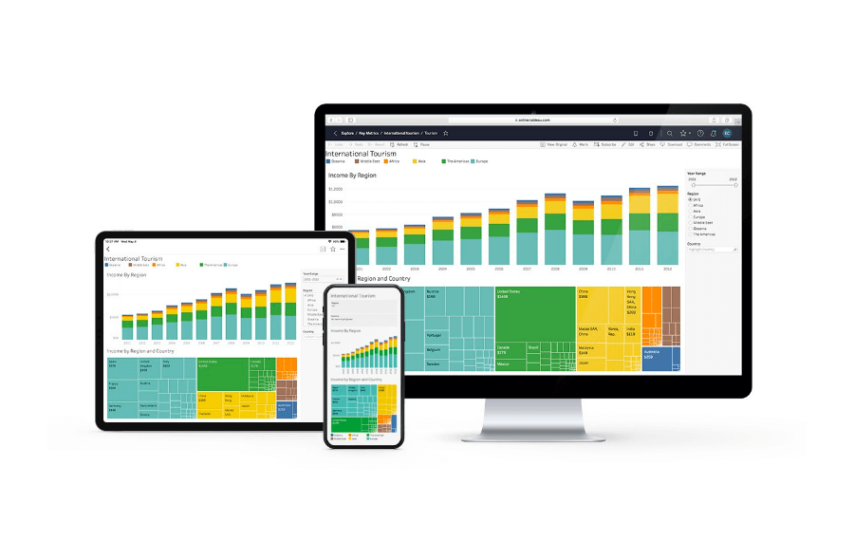
Tableau Dashboard:
Using text, graphical objects, and visualizations, among other things, Tableau Dashboards provide a comprehensive representation of your data. It is possible to provide data as a story on a dashboard. It may then be supplemented with additional views and objects, presented in various layouts and formats, and filtered as needed. Thanks to these additions, dashboards are a wealth of information. In addition, you can easily copy a dashboard or its components from one worksheet to another.
Collaboration & Sharing:
Tableau’s visualizations, sheets, dashboards, etc., make it easy for people to collaborate and quickly exchange data. It allows you to securely exchange information between hybrid, on-premises, and cloud-based environments. Through rapid, uncomplicated collaboration and data sharing, we may get critiques or feedback on the data quickly, which enhances the entire analysis.
Real-time and Memory-Based Information:
Tableau ensures access to external data sources for in-memory data extraction and supports real-time data sources. Therefore, the user is unrestricted in using data from any source. By establishing real-time connections to data sources, users may immediately consume or store the data in memory for later use. Data communication is simplified with the additional features made available by Tableau, such as automatic extract refreshes and notifications when a live connection fails.
Data Sources:
Data can be sourced from various locations and formats, including local files, spreadsheets, databases (both relational and non-relational), data warehouses, big data, and the cloud. Tableau also supports a wide variety of data connections.
Request Information:
The addition of the Ask data function has boosted Tableau’s profile among users all across the world. This feature makes modifying data as simple as using Google to look for information. Tableau allows you to ask questions about your data in plain English and get the answers that matter most. The solutions are presented in both text and visual formats. If the information you need is already on a bar chart, you may use the Ask data feature to open it immediately. More accessible access to these services benefits users who can rapidly dive deep into data and discover unique insights and trends.
Maps:
Tableau has a wealth of built-in map data, including locations of cities, postal codes, administrative boundaries, and more. Geological layers can be added to the map to provide your desired information. You can create several other kinds of maps in Tableau.
Robust Security:
Tableau blogs place a premium on the safety of their users’ data and the data itself. All data transmissions and user access are protected by a robust security system that relies on authentication and authorization techniques. Tableau may be integrated with other security systems. Important to remember is that Tableau uses row-level filtering, which helps keep data safe.
It’s no surprise that the exponential growth in internet users has coincided with a corresponding explosion in data. Consider how much prospective customers’ internet activities contribute to big data. The knowledge contained in this data might be invaluable to your company. Staying ahead of the competition requires business intelligence or actionable insights about the behavior and preferences of future consumers. By doing so, you may simplify your efforts to reach them. From massive amounts of data, this insight is gleaned.
However, this mountain of information is in its raw and unprocessed form, so it needs to be put to better use. The analysis of this data can be complicated, and it may be challenging to communicate the results to all relevant parties. Because only some have experience with data analytics, it’s essential to share your findings in a way that a nontechnical audience can grasp. That’s what you can accomplish with Tableau blog support. Sign up for Tableau training at Ohio Computer Academy to get hands-on Tableau software.