Here is the comprehensive guide to help you maintain a cool GPU & seamless gaming experience on Windows 11! It’s essential to keep an eye on your GPU’s temperature as technology advances & gaming visuals are more demanding in order to avoid overheating & possible performance problems.
To help you monitor the health of your system & get the most out of your gaming experience, we’ll look at a number of interactive ways to check your GPU temperature in Windows 11 in this article.
We have all the tools & advice you need to keep your GPU cool & productive on Windows 11, regardless of whether you like the simplicity of built-in services like Task Manager or the customization possibilities of third-party applications & Rainmeter widgets. Now let’s get started & explore the accurate methods to check your GPU temperature in windows 11!
Methods to Check Your GPU Temperature in Windows 11
Let’s examine each technique for maintaining GPU temperature in Windows 11 in more detail:
We’ll walk you through the process of using Windows 11 to monitor the warmth condition of your GPU. Let’s get straight into this manual. It’s possible that you’re merely curious about the cold or warm condition of your GPU or that you’re concerned about it overheating.
It doesn’t matter; I’ll teach you how to find out, & it’s more simple than you may imagine. You can do everything with Windows & don’t require any kind of third-party software.
1. Using Task Manager (Most Recommended Method)
Here are some simple steps to know about how to check your GPU temperature in Windows 11:
- To get started, launch your task manager on your PC.
- You may use the keyboard shortcut Ctrl Alt Delete to accomplish it. Once that’s green, you may click on task manager or, if you’d like, just go to the bottom, hit the search box, & enter task management exactly like this.
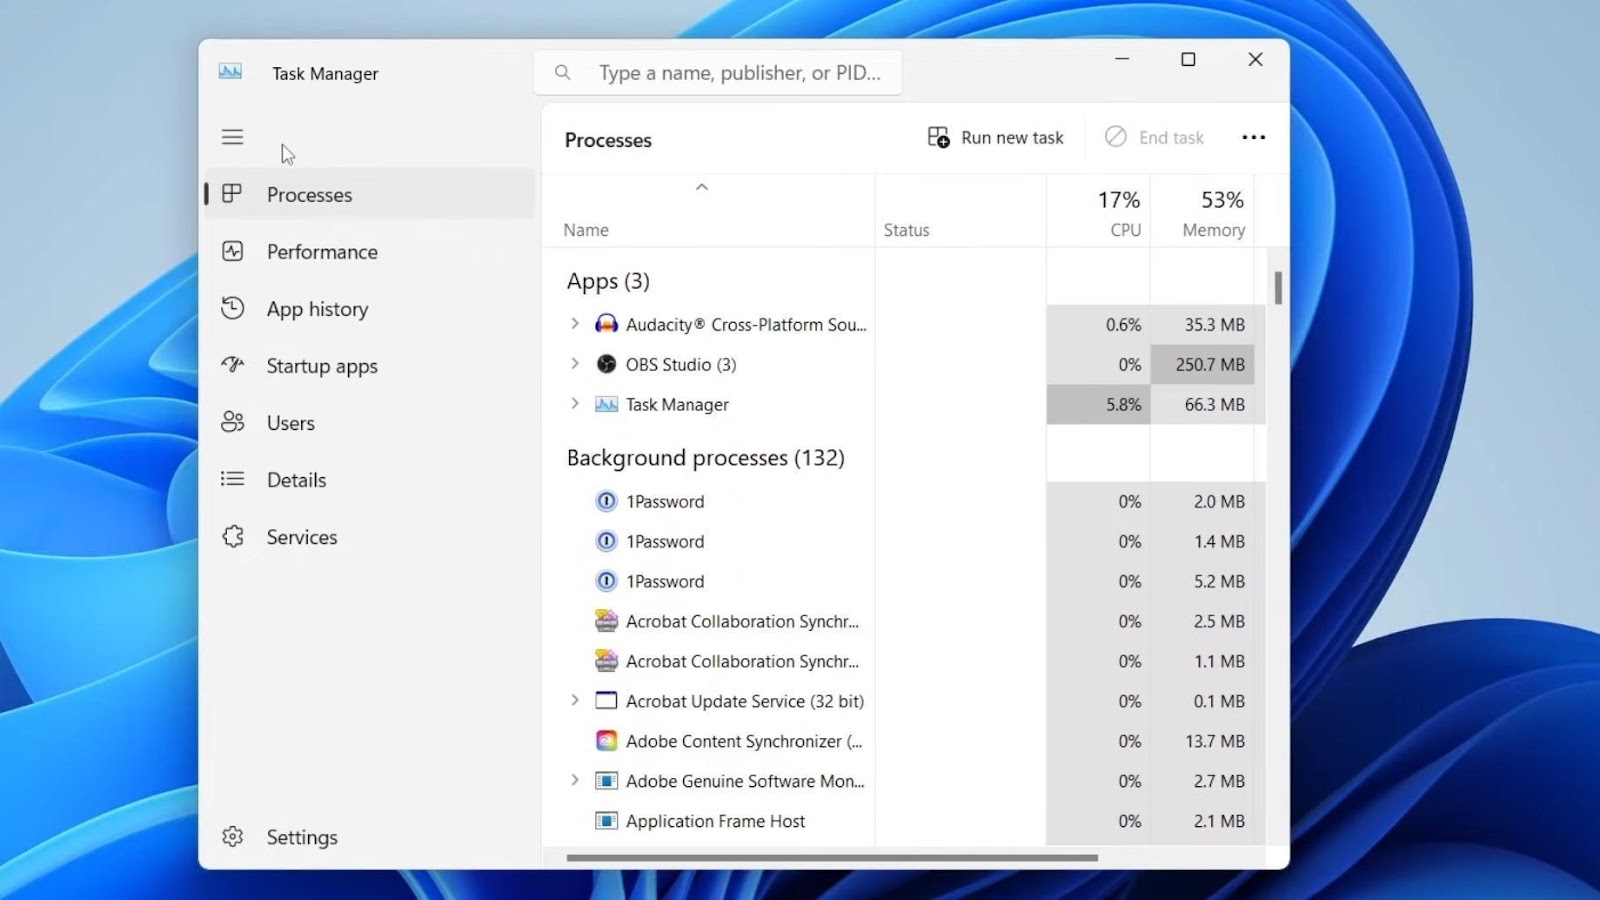
- It will then proceed to open up, & you will need to go to the left, where you will see this list of alternatives. This list may not be with you. You can see that it becomes much smaller if you click on these three bars here, but this list is still there. In any case, the second bar here is the one you want to select: performance.
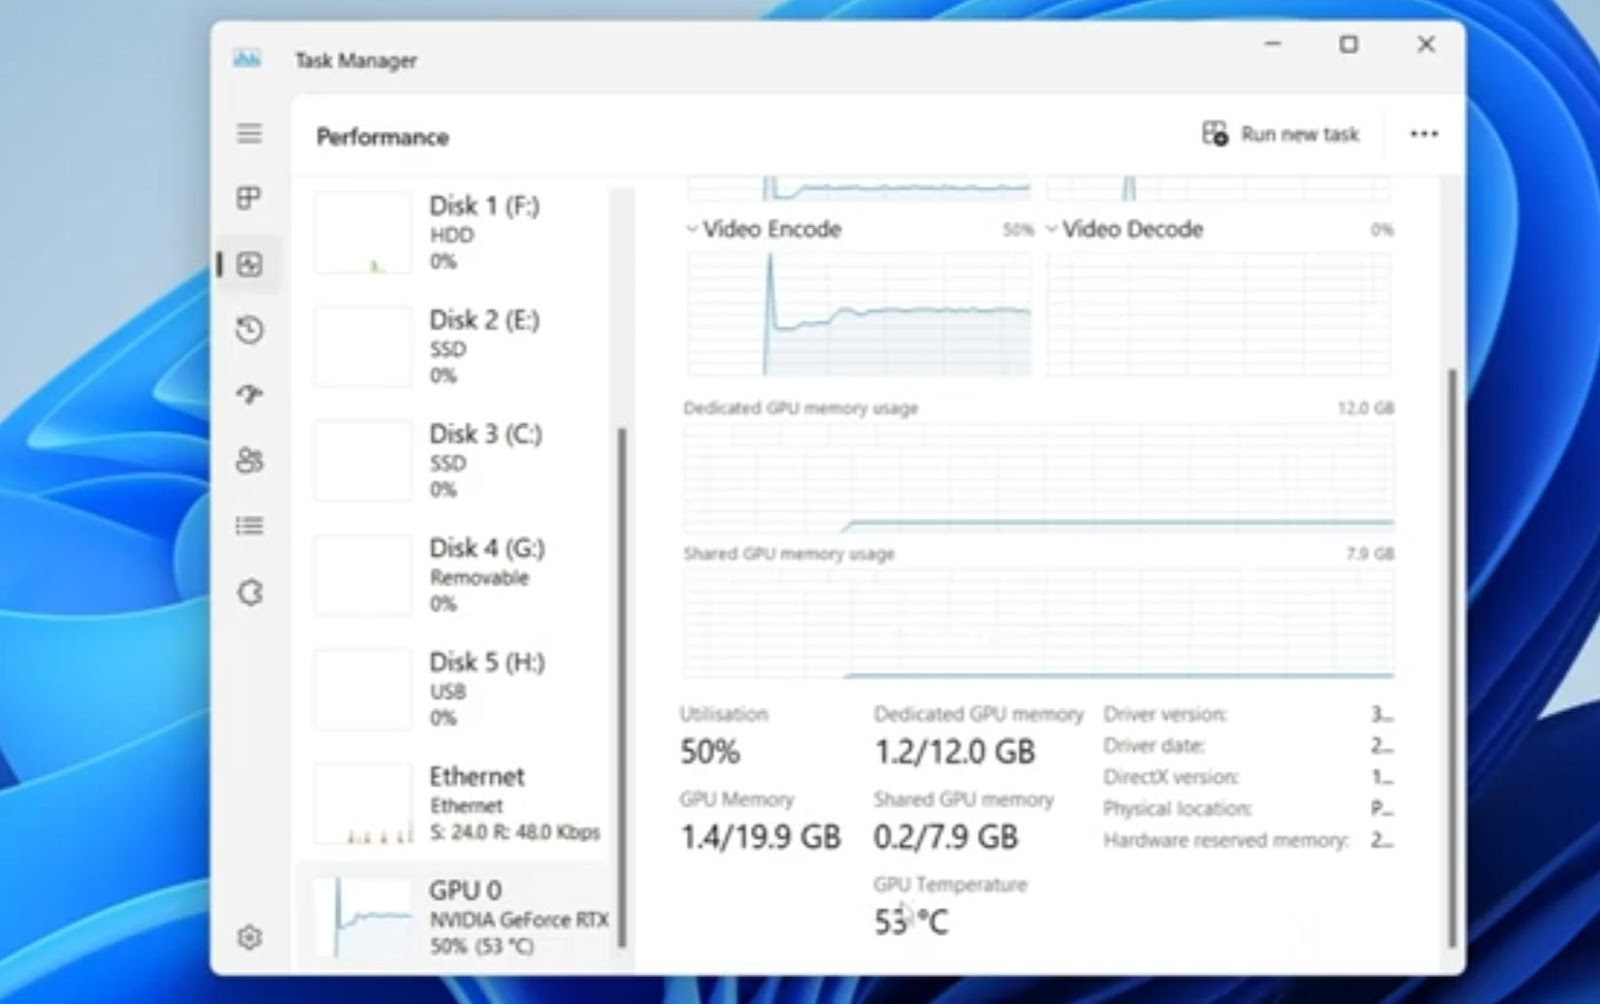
- So, click performance. From there, you can see my CPU & RAM.
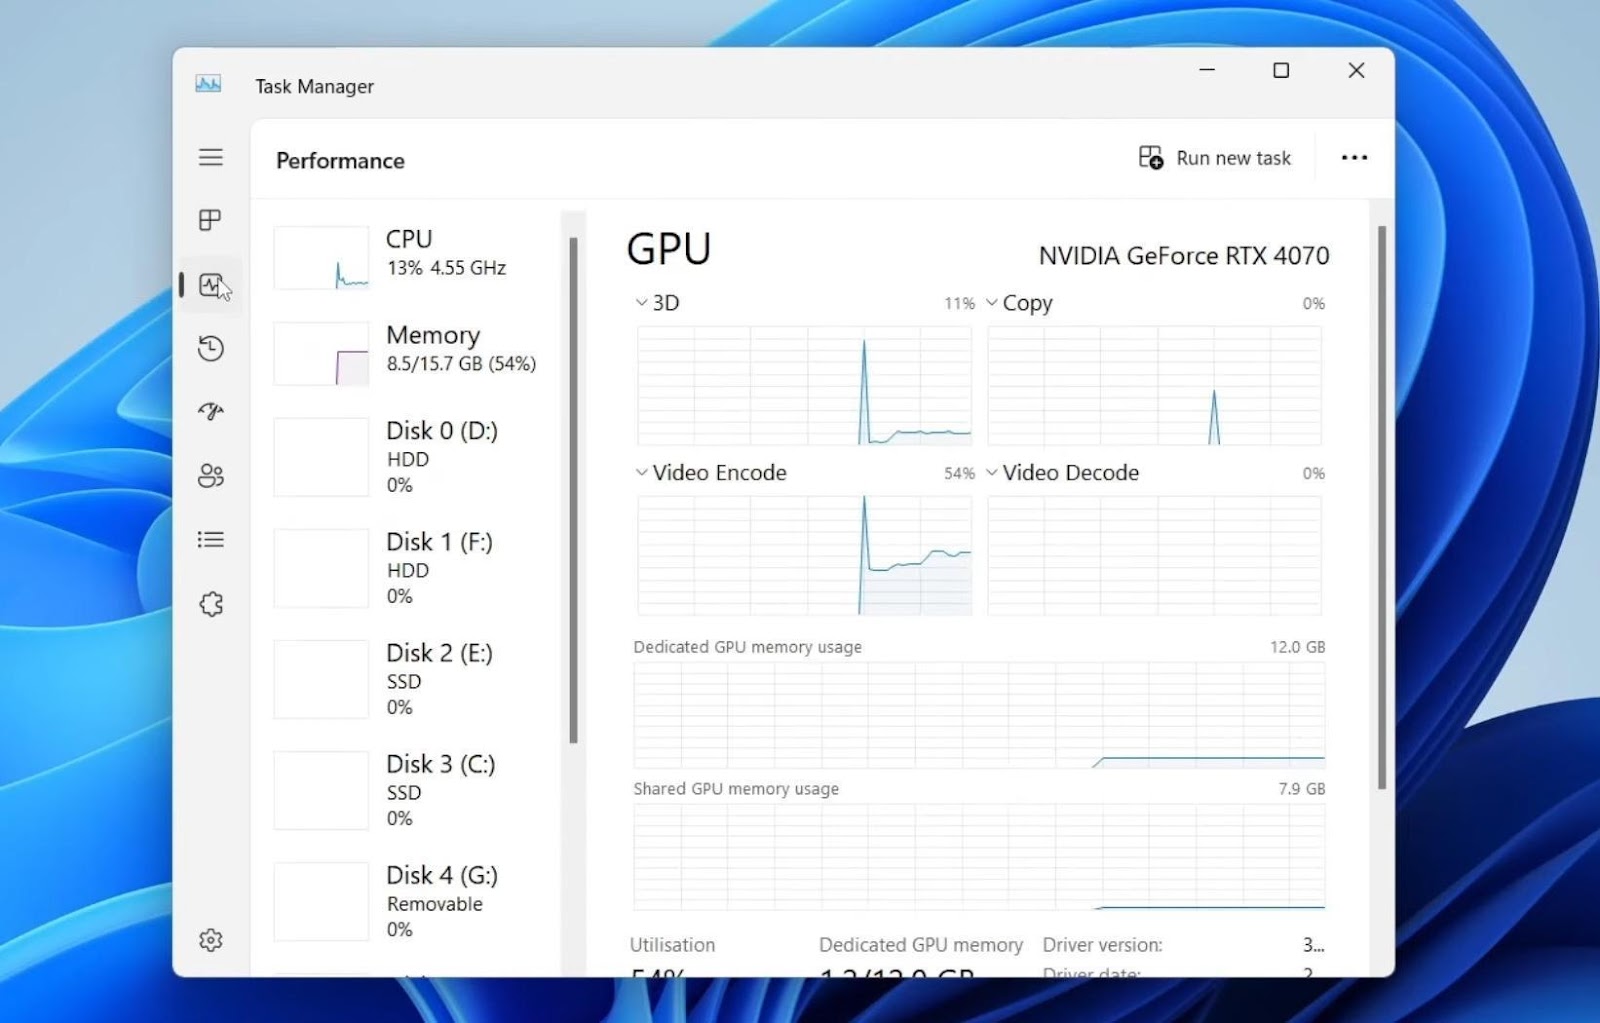
- You can also see my GPU, which is Nvidia, & how much is being used. You can also see the temperature. If you scroll down, you can see that I have quite a few disks. This is because my GPU is located right at the bottom.
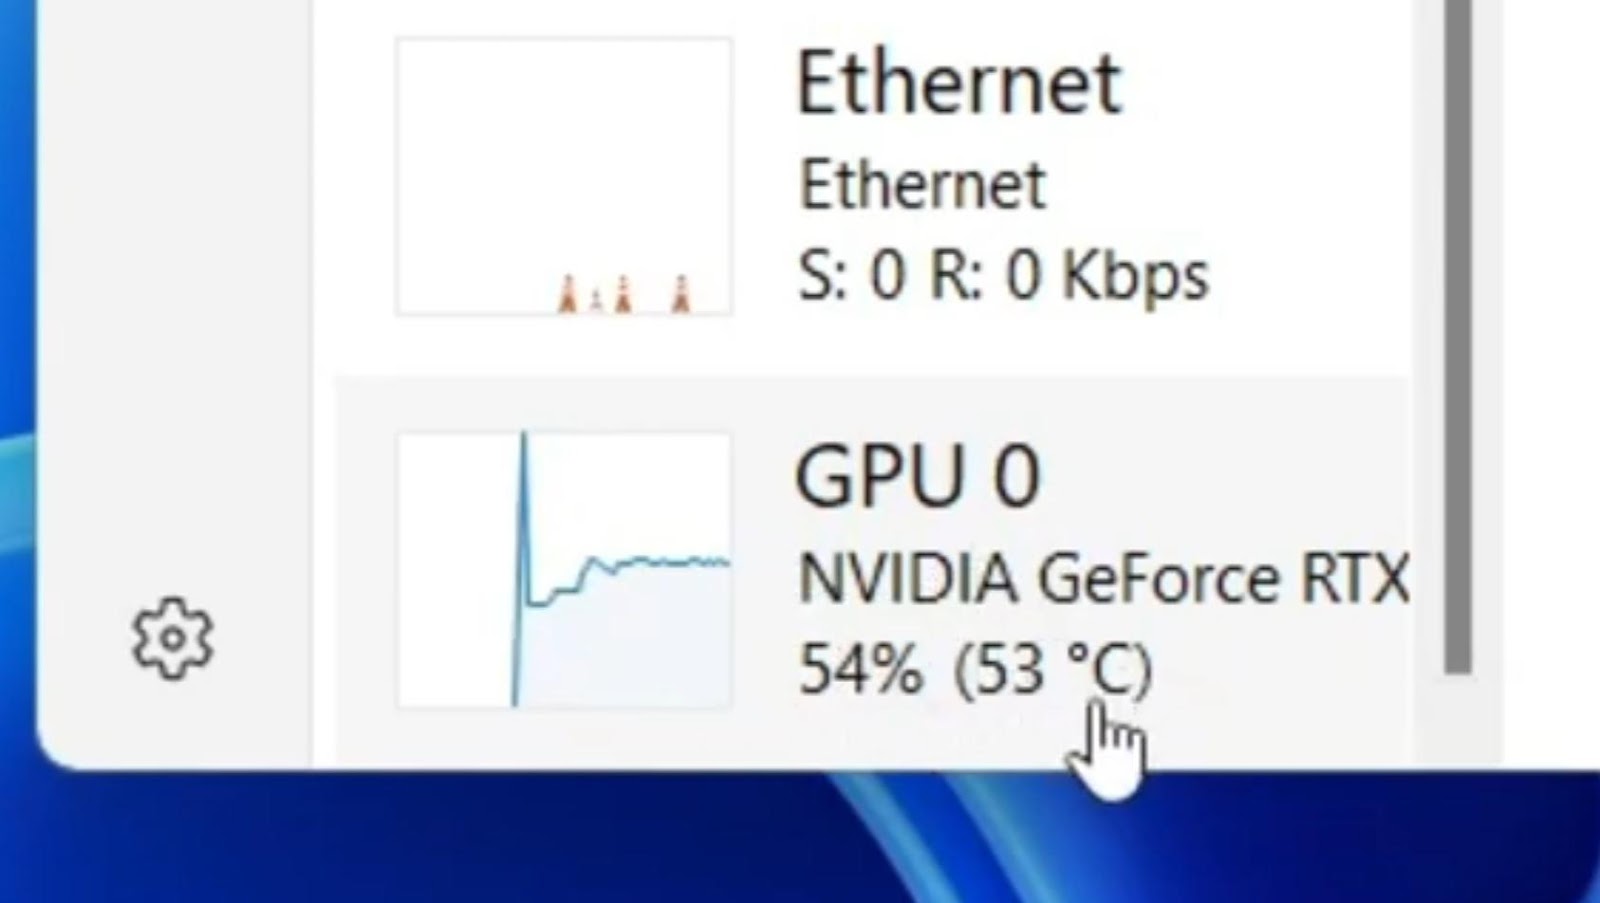
- Thus, as you can see, it’s 53 degrees here right now. You can scroll down & see the GPU temperature a little bit larger if I click on it as well.
2. Third-Party Software
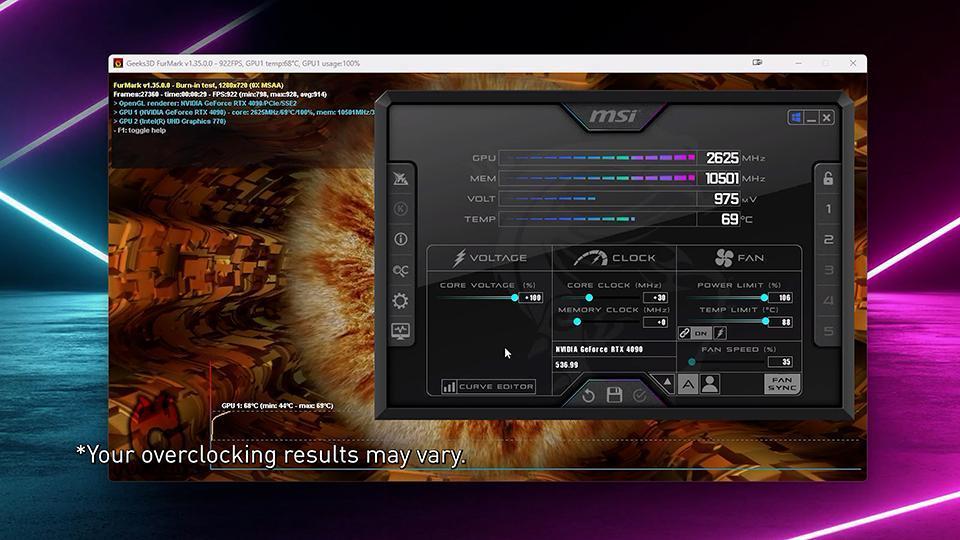
Image credit – MSI
- Compared to Task Manager, third-party programs like MSI Afterburner, GPU-Z, HWMonitor, & SpeedFan provide more sophisticated maintenance features.
- These programs provide real-time hardware metrics maintenance, like as use data, GPU temp, & fan speed.
- They often include extra capabilities like fan control & overclocking, as well as interfaces that may be customised.
- Depending on their needs & interests, users may download & install these GPU monitoring apps.
3. Manufacturer’s Software:
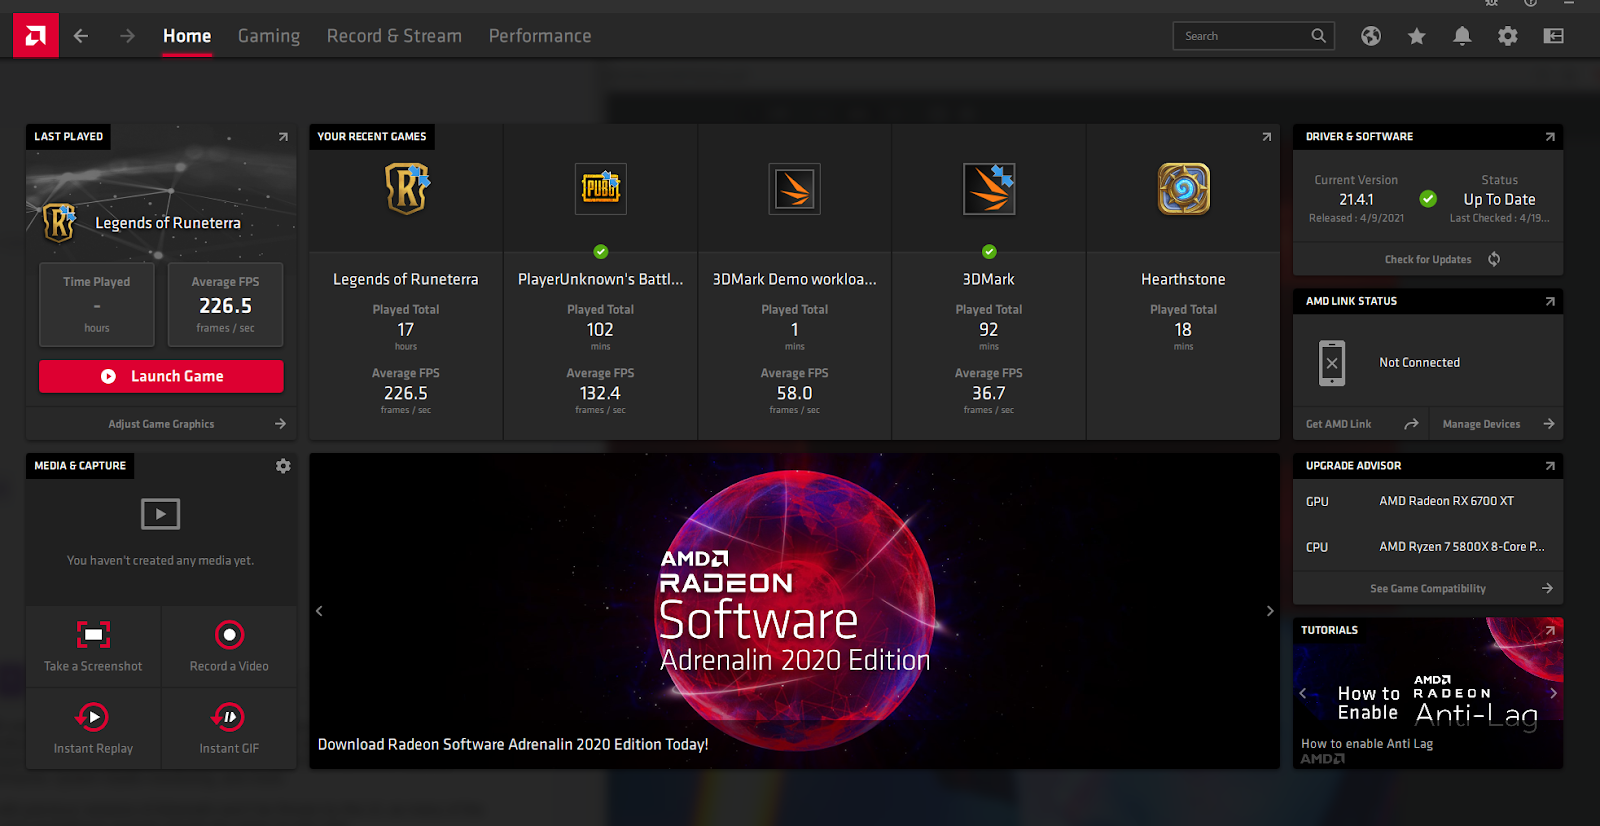
Image credit – PCMag
- The top GPU providers & competitors like Nvidia and AMD have their own softwares for their GPU’s.
- AMD have their own software called AMD Radeon Software where Nvidia has its own control panel and GetForce.
- These specific softwares will have regularly updated drivers with advance graphic settings & also GPU temperature information.
- These manufacturer-provided tools are available to users with AMD or NVIDIA graphics cards & allow for extensive GPU administration & monitoring.
4. BIOS/UEFI:
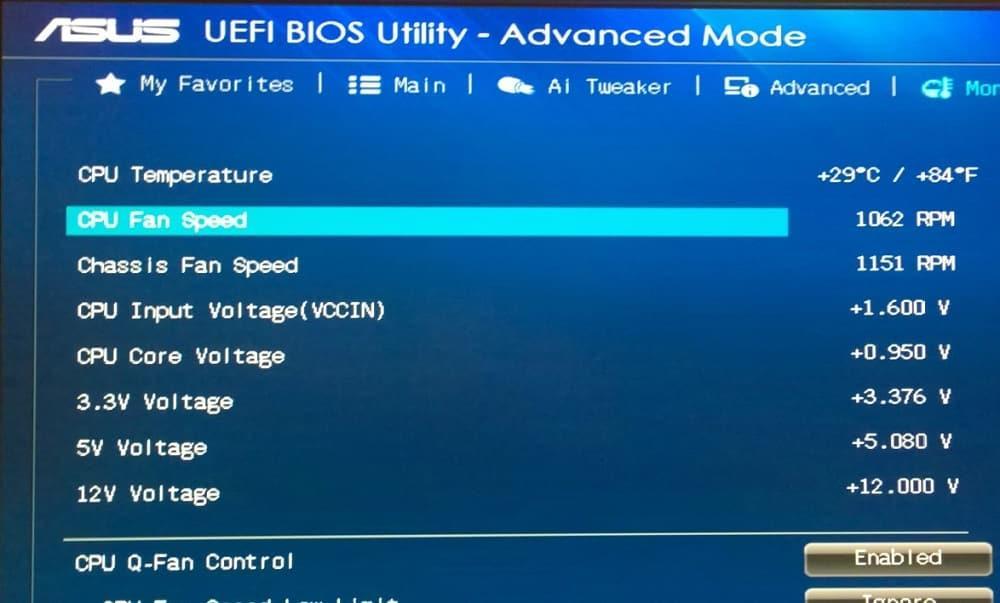
Image credit – The Wired Shopper
- Basic hardware maintaining features, like GPU temp monitoring, are provided via some motherboard BIOS/UEFI interfaces.
- By rebooting their computer & accessing the BIOS/UEFI interface during the boot process (often by hitting a particular key like Del, F2, or F10), users may access the BIOS/UEFI settings.
- This approach gives a low-level view of hardware characteristics & might be helpful for diagnostics, even if it might not enable real-time management.
5. Windows PowerShell:
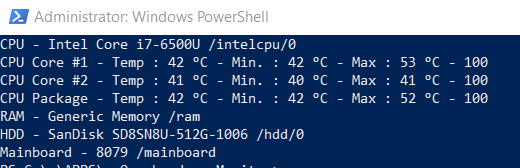
Image credit – Administrator
- Based on the.NET framework, Windows PowerShell is a command-line shell & scripting language.
- PowerShell commands allow users to query device specifications, such as GPU temperature.
- Certain PowerShell functions may be used to collect GPU-related information, including cold or warm condition, usage, & more.
- Advanced users & system administrators may get GPU temp information in a versatile & scriptable manner using PowerShell.
6. Rainmeter (configurable Desktop Widgets):
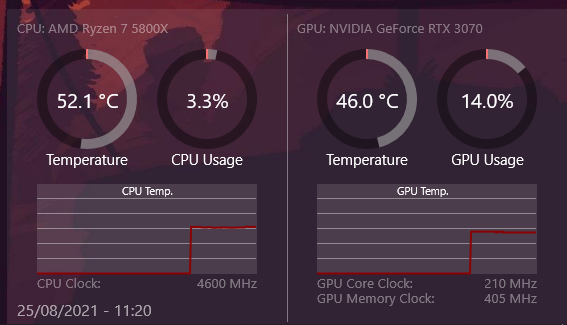
Image credit – Deviant Art
- Rainmeter is a tool for personalizing desktops that lets users design & show configurable desktop widgets.
- It comes with a number of GPU maintenance widgets that show GPU utilization, warmth condition, & other information.
- After downloading & installing Rainmeter, users may add GPU monitoring widgets to their desktops to suit their tastes.
- It provides an aesthetically pleasing & adaptable method for desktop GPU temp monitoring.
Frequently Asked Questions
Here are some frequently asked questions on how to check your GPU temperature in Windows 11:
1. Q: Does Windows 11 consist of any default tool to check GPU temperature?
Ans– Default application in your Windows 11, called Task Manager, uses a simple & accurate way to monitor GPU temperature.
2. Q: In Windows 11, what is the name of a well-liked third-party program that keeps track of GPU temperature?
Ans: A popular third-party program that provides sophisticated maintenance features, such as GPU temperature tracking, is MSI Afterburner.
3. Q: How do we know GPU temperature information on PowerShell?
Ans: Users may access GPU-related data, including temperature condition, by executing particular PowerShell commands, such as “Get-WmiObject -Namespace root\cimv2 -Class Win32_VideoController | Select-Object -ExpandProperty AdapterRAM”.
4. What kinds of Windows 11 graphics card management & monitoring features are offered by AMD & NVIDIA?
Ans: AMD offers AMD Radeon Software, which has functionality for maintaining GPU temp, whereas NVIDIA offers tools like NVIDIA Control Panel & GeForce Experience.
5. Q: How can I get GPU temperature widgets to show up immediately on my Windows 11 desktop?
Ans: A visually attractive & configurable option to monitor GPU temp is to utilise Rainmeter, a desktop widget program that lets users design & display GPU monitoring widgets.
Conclusion
Now that we’ve come to the end of this guide about how to check your GPU temperature in Windows 11, we know there are a ton of ways to make sure your graphics card stays cool & your gaming experience stays excellent. The most important lesson here is to always be aware of the warmth of your GPU, regardless of whether you want to utilise Rainmeter widgets for customisation, the sophisticated features of third-party applications, or the intuitive interface of Task Manager.
You may reduce the possibility of overheating-related performance problems & increase the longevity of your hardware by routinely checking & regulating the hold or cold condition of your GPU. Use the techniques described in this article, pay special attention to the temperature of your GPU, & play games on your Windows 11 machine without interruption. Cheers to fluid frame rates, sharp visuals, & many hours of gaming fun!